Soooooooo, that’s a funny title isn’t it?? One of my clients said to me the other day, “Feldenkrais is like the Quantum Physics of body work.” I thought that was pretty cool to hear as we were wrapping up our Functional Integration lesson. On my way home I was chuckling to myself about it. Then just a few days ago I cracked open a book I bought some years back about how we bring our hands to folks in a lesson and there it was…………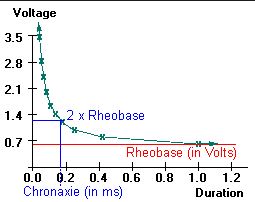
This is the strength duration curve I have been teaching Physical Therapy students about probably for the last 10 years or more. I used it in the context of how different nerve fibers are stimulated in response to electrical pulses. The vertical axis is the strength of the electrical pulse and the horizontal axis represents the duration of the pulse. The function of the nerve is represented by the curve. The nerves could be sensory, motor, sharp pain, or dull pain. Interestingly the labeling was different in the book by Yochanan Rywerant about The Feldenkrais Method. His graph was to represent Energy Exchange and Learning. He labeled the vertical axis as “energy exchanged” and the horizontal axis as “information transmitted.” The area indicated by the blue rectangle in Rywerant’s book is the upper limit of what can be conveyed in a Feldenkrais Lesson. He called it a “quantum of manipulation.” I taught my students that the area in the blue rectangle was the most efficient delivery of an electrical pulse that would stimulate the fiber you are interested in approaching. Rywerant pointed out the analogy to Heisenberg’s Principle of Uncertainty in atomic physics concerning the position of particles and momentum. So there you have it!!
But, a touche, not to be taken out by the physics of the matter or those who may not choose to view the world that way! This work just works!! It’s just the right amount of what you need to feel better, be better, do better. And that my friends makes the world a better place for everyone!! Who needs a graph for that?Cheers!! Sandy